


Example:
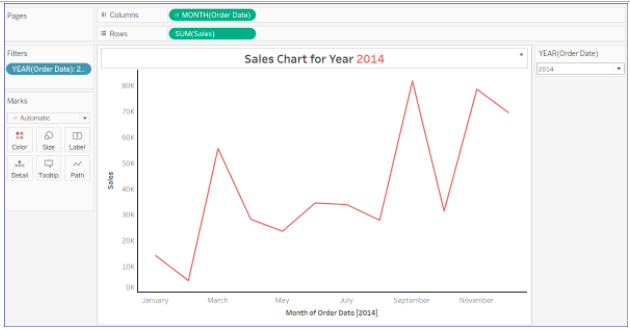
I have created a Sales line chart for every year using the Superstore dataset. My tableau workbook can be downloaded here.
Row Shelf: Order Date and check the Month option
Column Shelf: Sales
Filter: Drag Order Date to filter option and click “Years” and select all the years. Click the dropdown and select “Show Filter”. Year (Order Date) filter option will be displayed. Select “Single Value Dropdown” from the filter “Year (Order Date)”
Now go and edit the title and add Sales Chart for Year, then click insert and add “Year(Order Date)”.
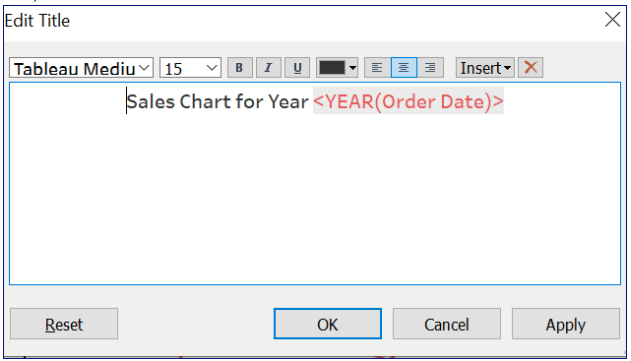
Now the title will reflect the year selected in the filter option.
2. Using parameter option
We can automate the title by using a parameter. The option selected in the parameter will automatically display in the title.
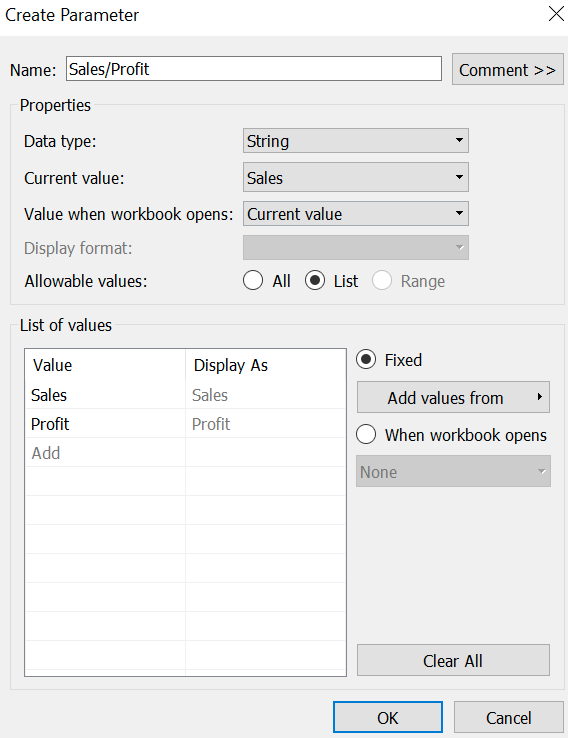
Step 1: Create a parameter.
Add the fields which you want to include in the title.
Here, I want to display Sales or Profit in the title based on the selection.
Step 2: Create a Calculated Field.
Case [Sales/Profit] When ‘Sales’ then [Sales]
When ‘Profit’ then [Profit]
END
This calculated field will match the parameter selection to the column you want to display.
If “Sales” is selected from Parameter option, then the “Sales” column will be shown.
Step 3: Create a visualization
We want to create a Sales Line Chart /Profit Line Chart over years
Row Shelf: Drag Order Date to the row shelf and select the Month option.
Column Shelf: Drag the calculated field we have created.
Right click the parameter “Sales/Profit” and click “Show Parameter”
Title: Edit the title and insert the parameter option and write Chart.
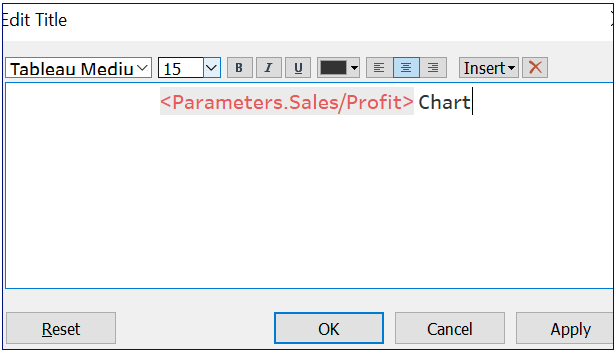
Now the title will dynamically reflect based on the option selected in the parameter.
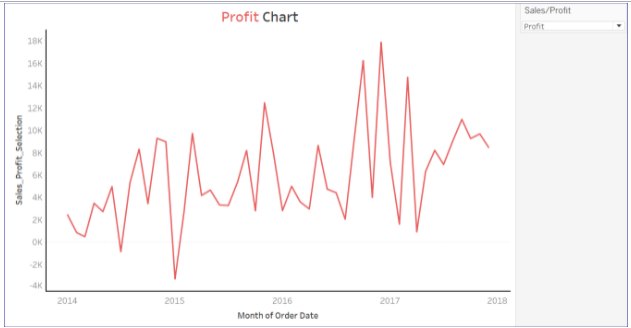
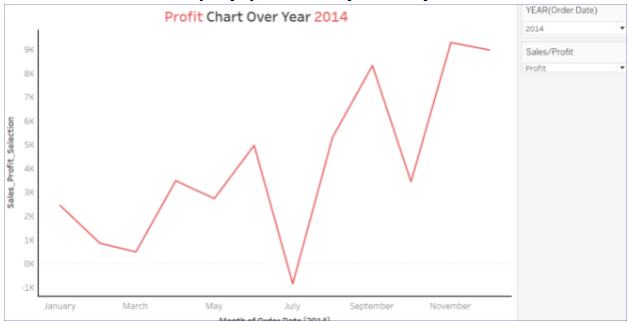
3. Using the filter and parameter option
Let’s create a Sales/Profit chart for a particular year selected.
The title should automatically display
1. Sales/ Profit [This can be done by using parameter]
2. Year [This can be done by using filter option]
Row Shelf: Drag Order Date to the row shelf and select Month option.
Column Shelf: Drag the calculated field we have created.
Right click the parameter “Sales/Profit” and click “Show Parameter”
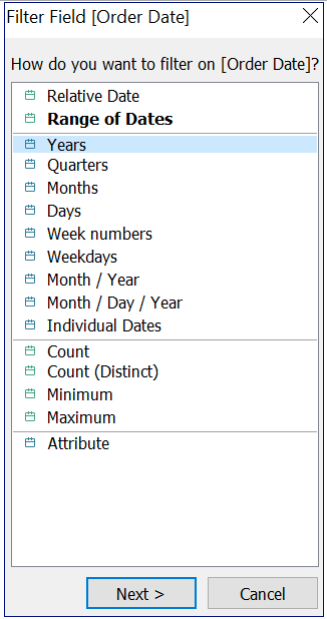
Filter Shelf: Drag the Order Date column and select “Year” and select all years and click ok.
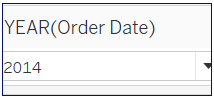
Right click and Click Show filter. Click the filter option and select single value (dropdown).
Title: Edit the title and insert the parameter option and write “Chart Over Year” and insert “Year (Order Date).
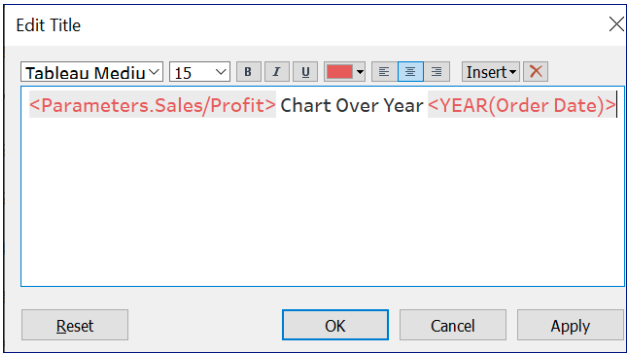
Now the title will automatically display the filter and parameter option selected.
Conclusion:
In this article, I have covered three different ways to automate a title in tableau. Thanks for reading and I hope you all like it.